Cell-type composition analysis in tissue domains
After identifying tissue domains that exhibit specific cell-type composition properties, it may be desirable to report the cell-type composition properties of the identified domains.
In the SSAM manuscript we used this functionality to identify that astrocytes cell type representation of neocortex layer were previously under-reported, and identified the cell-type composition of novel layering patterns in the primary visual cortex (VISp).
Performing the cell-type composition analysis
The analysis is initiated on the analysis object:
analysis.calc_cell_type_compositions()
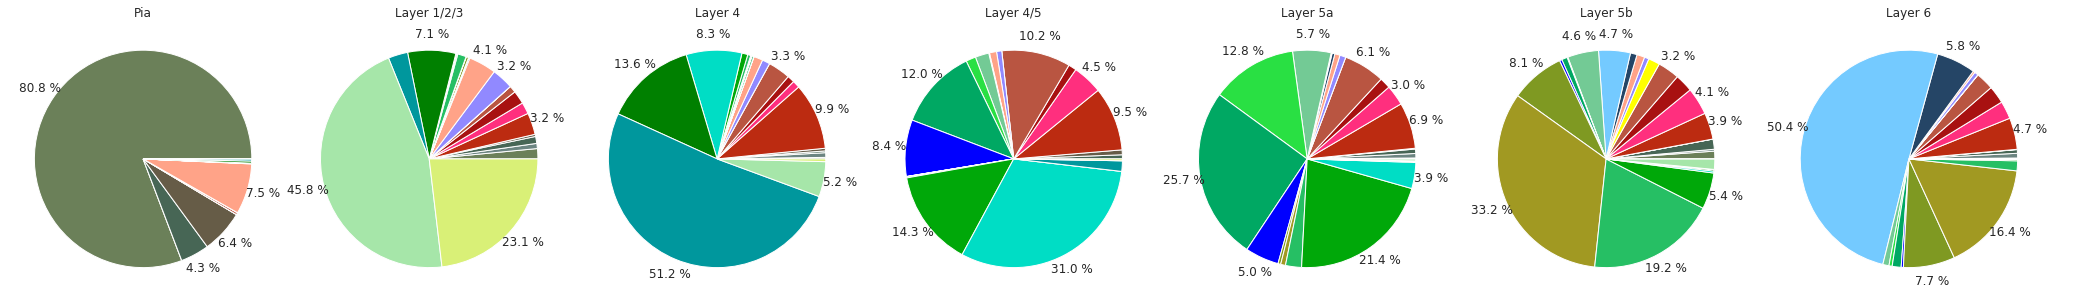
Plotting the composition of each domain
Once this has completed, you can plot the cell-type composition of the
different layers using the plot function. In the following exmaple, we
plot the 7 identified layers (domain_index = 0-6) in the order that
they would appear in the neocortex:
# note - this could be wrapped up into a function
for domain_idx in [1, 0, 2, 3, 4, 5, 6]:
    plt.figure(figsize=[5, 5])
    ds.plot_celltype_composition(domain_idx,
                                 cell_type_colors=denovo_celltype_colors,
                                 cell_type_orders=heatmap_clusters_index[::-1],
                                 label_cutoff=0.03)
    plt.title(domain_labels[domain_idx])
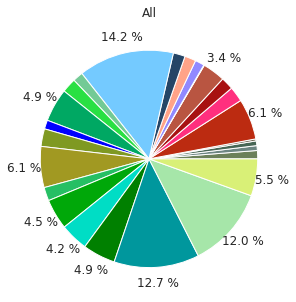
Plotting the composition of the entire tissue
It would be worthwhile to compare the cell-type composition within each
domain, and compare this to what is observed over the entire tissue. The
cell-type compostion over the entire tissue is stored as the last
domain, in this case the 8th element (domain_index = 7):
# note - this can be wrapped up into a function
plt.figure(figsize=[5, 5])
ds.plot_celltype_composition(domain_index=7,
                             cell_type_colors=denovo_celltype_colors,
                             cell_type_orders=heatmap_clusters_index[::-1],
                             label_cutoff=0.03)
plt.title('All')