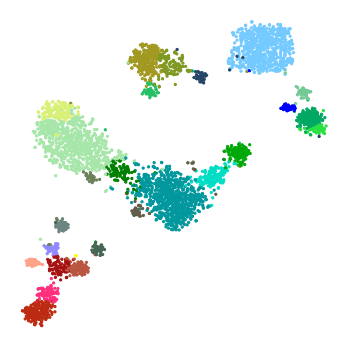
Visualisation of 2D gene expression embeddings (t-SNE and UMAP)
An important part of presenting the summary of the clustering analysis is 2D visualisation via embedding.
UMAP and t-SNE, are 2 common dimensionality reduction methods that can be useful for displaying clustering results.
Running t-SNE
To run the t-SNE on the ds object:
ds.run_tsne(pca_dims=-1,n_iter=5000, perplexity=70, early_exaggeration=10, metric="correlation", exclude_bad_clusters=True, random_state=0, tsne_kwargs={})
pca_dims: Number of PCA dimensions used for the tSNE embedding.n_iter: Maximum number of iterations for the tSNE.perplexity: The perplexity value of the tSNE (please refer to the section How should I set the perplexity in t-SNE? ).early_exaggeration: Early exaggeration parameter for tSNE. Controls the tightness of the resulting tSNE plot.metric: Metric for calculation of distance between vectors in gene expression space.exclude_bad_clusters: If true, the vectors that are excluded by the clustering algorithm will not be considered for tSNE computation.random_state: Random seed or scikit-learn’s random state object to replicate the same resulttsne_kwargs: Other keyward parameters for tSNE.
Running UMAP
To run the t-SNE on the ds object:
ds.run_umap(self, pca_dims=-1, metric="correlation", min_dist=0.8, exclude_bad_clusters=True, random_state=0, umap_kwargs={})
pca_dims: Number of PCA dimensions used for the UMAP embedding.metric: Metric for calculation of distance between vectors in gene expression space.min_dist: ‘min_dist’ parameter for UMAP.exclude_bad_clusters: If true, the vectors that are excluded by the clustering algorithm will not be considered for UMAP computation.random_state: Random seed or scikit-learn’s random state object to replicate the same resultumap_kwargs: Other keyward parameters for UMAP.
Plotting embeddings
Plotting of the t-SNE and UMAP beddings can be performed by:
ds.plot_embedding(method='umap')
ds.plot_embedding(method='tSNE')