SSAM guided analysis
The main visual output of SSAM is the creation of the cell-type map, which is created by classifying pixels in the tissue image based of either predefined or calculated genes expression signatures. When the gene expression signatures are already known, one can use SSAM in guided mode. When previously known cell type signatures are known, we highly recommend running guided mode analysis as a quality check.
Single cell RNA sequencing data
We will use scRNA-seq data from Tasic et al. 2018 for the guided analysis. In the paper they identified “shared and distinct transcriptomic cell types across neocortical areas” in the mouse brain, also including the mouse VISp (which is our exmaple).
First we need to load the data:
scrna_cl = pd.read_feather("zenodo/multiplexed_smFISH/raw_data/scrna_data_tasic_2018/cl.feather")
scrna_cl_df = pd.read_feather("zenodo/multiplexed_smFISH/raw_data/scrna_data_tasic_2018/cl_df.feather")
scrna_genes = pd.read_feather("zenodo/multiplexed_smFISH/raw_data/scrna_data_tasic_2018/genes.feather")
scrna_counts = pd.read_feather("zenodo/multiplexed_smFISH/raw_data/scrna_data_tasic_2018/counts.feather")

scrna_clusters = scrna_cl['cluster_id']

scrna_cl_dic = dict(zip(scrna_cl['cell_id'], scrna_cl['cluster_id']))
scrna_cl_metadata_dic = dict(zip(
    scrna_cl_df['cluster_id'],
    zip(scrna_cl_df['cluster_label'],
        scrna_cl_df['cluster_color'], )
))

qc_gene_indices = np.sum(scrna_counts > 0, axis=1) > 5
scrna_genes_qc = np.array(scrna_genes)[qc_gene_indices]

scrna_counts_qc = np.array(scrna_counts).T[:, qc_gene_indices]
Normalisation
Once the data is loaded, we will normalise it using run_sctransform:
scrna_data_normalized = np.array(ssam.run_sctransform(scrna_counts_qc)[0])
Cell-type gene expression signatures
Once the data is normalised, we can calculate the average gene
expression per cell type (the centroids), which can then be used for
classifying pixels in the image
selected_genes_idx = [list(scrna_genes_qc).index(g) for g in ds.genes]
scrna_uniq_clusters = np.unique(scrna_clusters)
scrna_centroids = []
for cl in scrna_uniq_clusters:
    scrna_centroids.append(np.mean(scrna_data_normalized[:, selected_genes_idx][scrna_clusters == cl], axis=0))
Generate a guided cell-type map
We can now continue to classify pixels in the tissue image using the cell-type gene expression signatures from the sc-RNAseq data.
We map the local maxima vectors to the most similar clusters in the scRNA-seq data using, using a correlation threshold of classifying pixels of ``0.6` <celltype_map_thresh_g.md>`__
analysis.map_celltypes(scrna_centroids) # map the scRNAseq cell type signatures to the tissue image
analysis.filter_celltypemaps(min_norm=filter_method, filter_params=filter_params, min_r=0.3, output_mask=output_mask) # post-filter cell-type map to remove spurious pixels

plt.figure(figsize=[5, 5]) # initiate the plotting area
ds.plot_celltypes_map(rotate=1, colors=scrna_colors, set_alpha=False) # SSAM plotting function
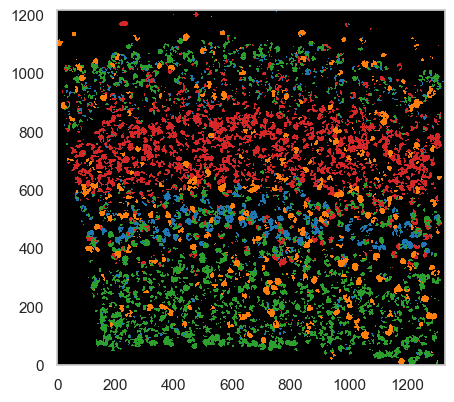
Despite the guided mode producing passable results, we highly recommend using the de novo mode for more accurate analysis.