Segmenting the SSAM cell type map
While we demonstrate the accuracy of SSAM in reconstructing celltype
maps, we understand that many applications in biology require cell
segmentation. As such, the development branch of SSAM supports
segmentation of the celltype map using the watershed algorithm.
The run_watershed method takes the DAPI image as input and segments
the celltype map using the watershed algorithm. The DAPI image is used
as markers for the watershed segmentation. The segmentations and the
segmented celltype map are stored in the watershed_segmentations and
watershed_celltype_map attributes of the Dataset object.
The segmentation of the cell type map can be performed by:
# Load DAPI image
with open('zenodo/osmFISH/raw_data/im_nuc_small.pickle', 'rb') as f:
    dapi = pickle.load(f)
dapi_small = np.hstack([dapi.T[:1640], np.zeros([1640, 12])]).reshape(ds.vf_norm.shape)

# Threshold DAPI image to create markers
dapi_threshold = filters.threshold_local(dapi_small[..., 0], 35, offset=-0.0002)
dapi_thresh_im = dapi_small[..., 0] > dapi_threshold
dapi_thresh_im = dapi_thresh_im.reshape(ds.vf_norm.shape).astype(np.uint8) * 255

# Run watershed segmentation of cell-type maps with DAPI as markers
analysis.run_watershed(dapi_thresh_im, df) # df is the dataframe containing the spot locations
Below we demonstrate the application of the segmentation on the de novo celltype map generated for the mouse SSp osmFISH data.
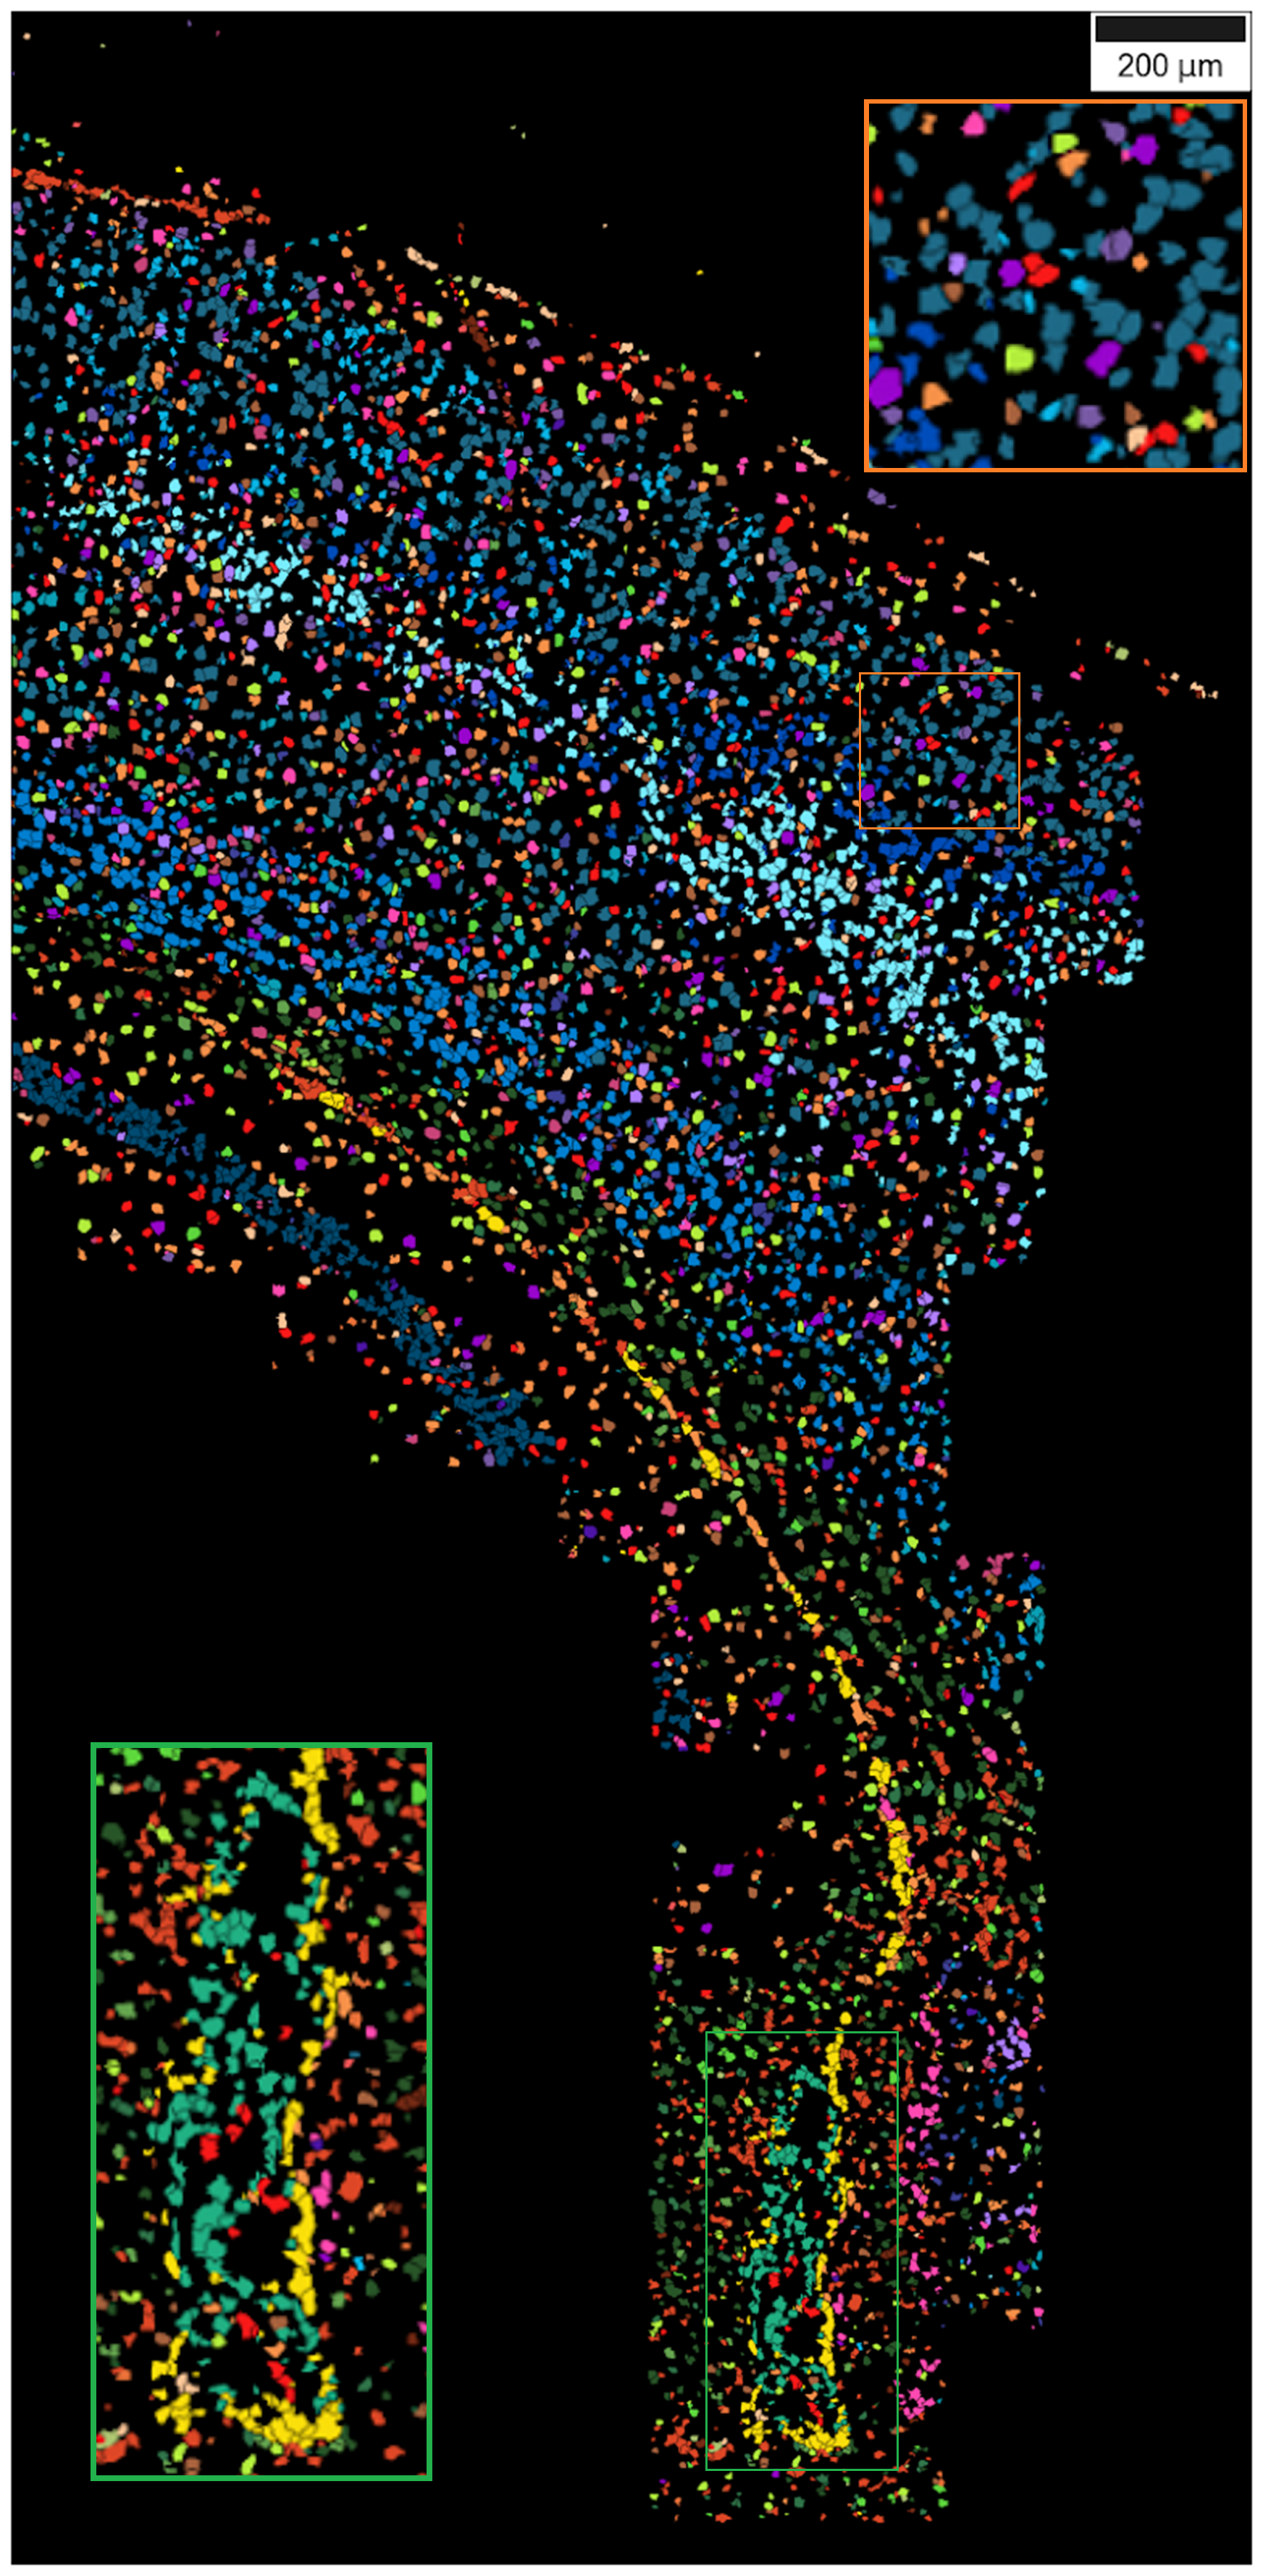
After running the watershed segmentation, the cell by gene matrix and the center of mass of the segmented celltype map can be used to generate a cell by gene matrix for the segmented celltype map. This can be used for further downstream analysis such as cell-cell communication analysis.
The cell by gene matrix can be accessed by cell_by_gene_matrix and the center of mass
of the segments can be accessed by center_of_masses attributes of the SSAMDataset
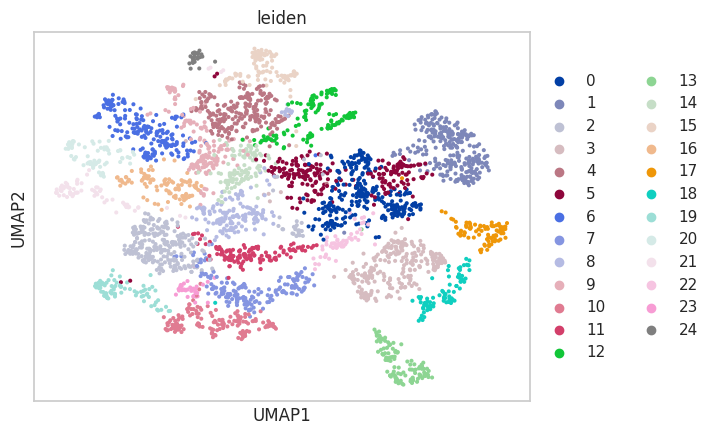
object. Below we demonstrate a simple reanalysis of the segmented celltype map using
Scanpy.
import scanpy as sc
adata = sc.AnnData(ds.cell_by_gene_matrix)

sc.pp.normalize_total(adata, target_sum=1e4)
sc.pp.log1p(adata)
sc.pp.scale(adata)
sc.pp.neighbors(adata, n_neighbors=10, n_pcs=40)

sc.tl.umap(adata)
sc.tl.leiden(adata)
sc.pl.umap(adata, color='leiden')
plt.figure(figsize=(5, 5))
plt.scatter(ds.center_of_masses[:, 0], ds.center_of_masses[:, 1], c=[int(i) for i in adata.obs['leiden']], cmap='tab20', s=5)
