Quick start / tldr page
This tl;dr guide is for you if you already know what happens in a SSAM analysis or if you don’t care.
For everyone else we recommend using the full userguide.
Installation
Setup a conda environment:
conda create -n ssam python=3.11 numpy=2.0.2 gxx_linux-64
conda activate ssam
Install SSAM via pip:
pip install ssam
It is also possible to install the development version of SSAM from
the GitHub repository:
pip install git+https://github.com/pnucolab/ssam.git
Example Data
All following steps in python:
import pandas as pd
import matplotlib.pyplot as plt
import ssam

# Load example data
df = pd.read_csv(
        "https://s3.amazonaws.com/starfish.data.spacetx/spacetx-website/data/smFISH_Allen/s3_spot_table.csv",
        usecols=["rotated_x", "rotated_y", "gene"]
     )

# Rename columns to match the format SSAM expects: x, y, gene
df = df.rename(columns={'rotated_x': 'x', 'rotated_y': 'y'})

# Normalize coordinates
df.x -= df.x.min()
df.y -= df.y.min()

# Set the width and height of the tissue
width = df.x.max()
height = df.y.max()
Create SSAM dataset and vector field
# Create a new SSAM dataset
ds = ssam.SSAMDataset("ssam_msmfish") # This will create a new directory named "ssam_msmfish" in the current working directory

# Create a SSAM analysis object
analysis = ssam.SSAMAnalysis(ds, verbose=True)

# Run KDE
analysis.run_kde(df, width=width, height=height)

# Find local maxima
analysis.find_localmax()

# Normalize and scale vectors
analysis.normalize_vectors()
analysis.scale_vectors()
Creating the de novo cell map
# Cluster vectors
analysis.cluster_vectors(resolution=0.6, metric='correlation')

# Map cell types
analysis.map_celltypes()
analysis.filter_celltypemaps(min_norm=0.05) # Adjust `min_norm` for filtering

# Plot cell type map
plt.figure(figsize=(5, 5))
ds.plot_celltypes_map()
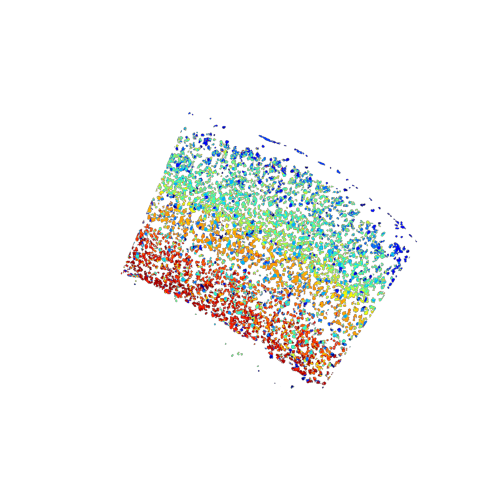
Visualisation of cell type map.
Creating the tissue domain map
# Create binned cell type maps
analysis.bin_celltypemaps(step=10, radius=100)

# Find domains
analysis.find_domains(n_clusters=20, merge_remote=True, merge_thres=0.7, norm_thres=1500)

# Plot domain map
plt.figure(figsize=[5, 5])
ds.plot_domains()