SSAM guided analysis
The main visual output of SSAM is the creation of the cell-type map, which is created by classifying pixels in the tissue image based of either predefined or calculated genes expression signatures. When the gene expression signatures are already known, one can use SSAM in guided mode. When previously known cell type signatures are known, we highly recommend running guided mode analysis as a quality check.
Single cell RNA sequencing data
We will use scRNA-seq data from Tasic et al. 2018 for the guided analysis. In the paper they identified “shared and distinct transcriptomic cell types across neocortical areas” in the mouse brain, also including the mouse VISp (which is our exmaple).
First we need to download the data:
!curl -L https://ndownloader.figshare.com/files/26404781 -o sc_mouse_cortex.h5ad # data grabbed from SquidPy tutorial
Then we can load the data using scanpy:
# ``scanpy`` is needed for loading the data, install it with ``pip install scanpy``
import scanpy as sc
adata = sc.read_h5ad("sc_mouse_cortex.h5ad")

# filter out and reorder genes according to the SSAM dataset ds.genes
adata = adata[:, adata.var_names.isin(ds.genes)]
adata = adata[:, ds.genes]
Cell-type gene expression signatures
Once the data is loaded, we can calculate the average gene
expression per cell type (the centroids), which can then be used for
classifying pixels in the image
scrna_clusters = []
scrna_centroids = []
for cl, grp in adata.obs.groupby("cell_class"):
   scrna_clusters.append(cl)
   scrna_centroids.append(
      adata[grp.index].X.mean(axis=0).A1 # ``A1`` is used to convert the matrix to a numpy array
   )
Generate a guided cell-type map
We can now continue to classify pixels in the tissue image using the cell-type gene expression signatures from the sc-RNAseq data.
We map the local maxima vectors to the most similar clusters in the scRNA-seq data.
By default, the filter_celltypemaps function will remove pixels that
do not correlate with any of the cell types above a certain threshold.
This is done to remove spurious pixels that do not belong to any cell
type.
By default, the threshold (min_r parameter) is set to 0.6, but
you can adjust it if needed. In this example, we set it to 0.3, as
the scRNA-seq data is generated from a different tissue and the gene
expression signatures might not be as similar.
You can specify the colors of the cell types using the colors
parameter. The colors should be a list of matplotlib colors, where the
order corresponds to the order of the cell types in the scrna_centroids.
analysis.map_celltypes(scrna_centroids)
analysis.filter_celltypemaps(min_r=0.3, min_norm=0.05) # Adjust `min_norm` for filtering
plt.figure(figsize=(5, 5))
ds.plot_celltypes_map(colors=adata.uns['cell_class_colors'])
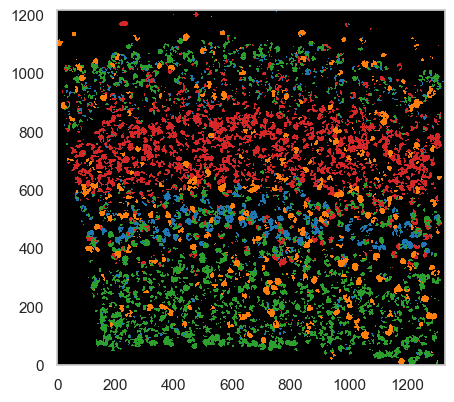
Despite the guided mode producing passable results, we highly recommend using the de novo mode for more accurate analysis.
We can now use our celltype map to infer a map of tissue domains.