Creating the vector field
SSAM converts the discrete mRNA locations into mRNA desntiy (that can be thought of as continuous “gene expression clouds” over the tissue) through application of Kernel Density Estimation.
Prepare data for KDE
To run KDE, we need to provide the data with the width and
height of the image. It is straightforward to use the maximum
coordinates of the mRNA spots for this:
width = df.x.max()
height = df.y.max()
Run KDE
Now you can calculate a mRNA density estimate with the run_kde method.
You can specify the dataframe (with x, y, and gene columns),
width, height.
An important consideration here is the kernel bandwidth. As default, we recommend using a Gaussian kernel with a bandwidth of 2.5:
# `bandwidth` is optional (default is 2.5)
analysis.run_kde(df, width=width, height=height, bandwidth=2.5)
Local maxima search and normalization
In order to reduce the computational burden, we use the local maxima of the mRNA density as a proxy for the spatial gene expression from cells.
Here we apply the find_localmax function to find the local maxima of
the mRNA density:
analysis.find_localmax(
    min_norm=0.2, # optional, the total gene expression threshold
    min_expression=0.027, # optional, the per gene expression threshold
)
Now SSAM automatically finds the optimal norm and expression thresholds for the local maxima search. However, you can adjust these parameters if needed.
Visualization
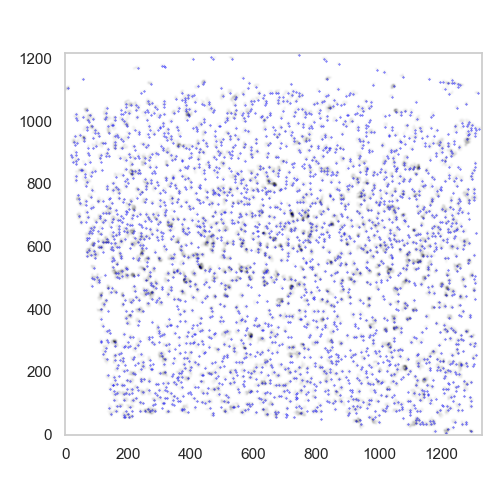
After the local maxima have been identified, they can be visualised:
plt.figure(figsize=[5, 5])
ds.plot_l1norm(cmap="Greys")
ds.plot_localmax(c="Blue", s=0.1)
The plot will show the local maxima as blue dots superimposed on the norm of the vector field.
plot found maxima superimposed with the mask
Normalization
Once the local maxima have been identified, we can normalize the mRNA
density and the local maxima vectors. This is done by either the
normalize_vectors or normalize_vectors_sctransform method.
The normalize_vectors method normalizes the mRNA density and the
local maxima vectors using log normalization of pseudocounts. This is
currently the default method in SSAM.
analysis.normalize_vectors()
Alternatively, you can use the sctransform method for normalization:
analysis.normalize_vectors_sctransform() # requires pyarrow, R and sctransform package
Now we are ready to continue with mapping the cell types in de novo or guided mode.